Analytics & Insights Dashboard: Understand How Conversations Are Going
Conversation volume, punchcard heatmaps, outcome distributions, sentiment trends, and language breakdowns — all filterable by agent or tag.
Deploying an agent is the beginning of the work, not the end of it. To improve an agent over time, you need to understand how it’s actually being used — what’s being asked, when conversations are happening, whether outcomes are positive, and where the agent is falling short.
The Agentwise Analytics Dashboard brings all of this into one place.
What’s in the Dashboard
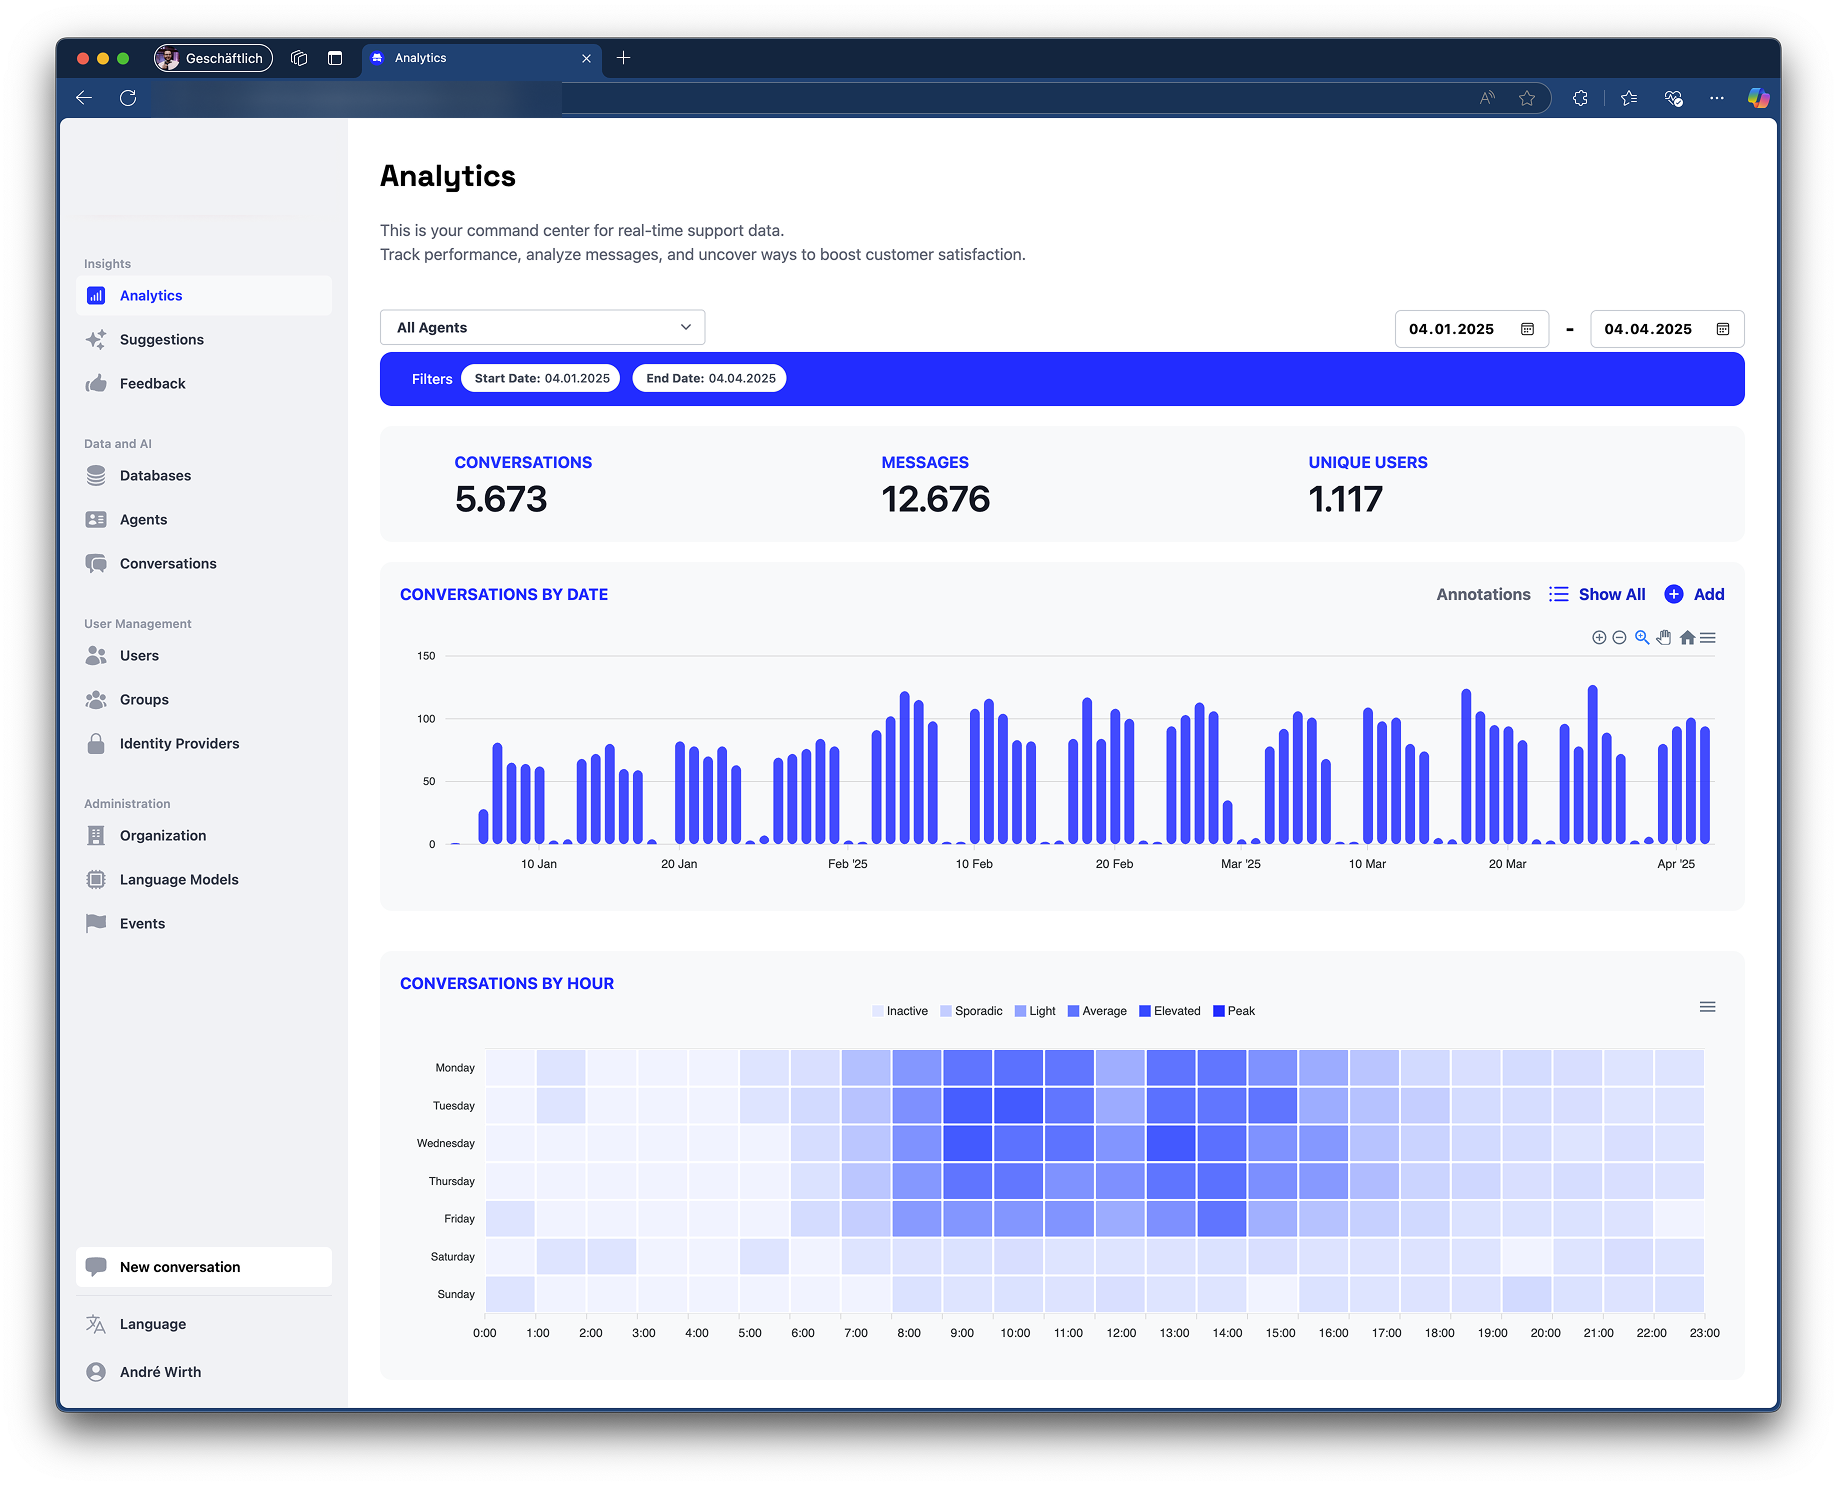
Conversation volume — See how many conversations are happening per day and per week, with weekend bars highlighted so you can distinguish working-day patterns from off-hours usage at a glance.
Punchcard heatmap — A grid of hours vs. days shows when your agents are busiest. This is useful for capacity planning and for understanding whether usage patterns align with your expectations (or reveal something surprising).
Outcome distribution — Every conversation ends somewhere. The dashboard shows how outcomes are distributed — resolved, escalated, abandoned, or other states you’ve defined. A healthy agent should show a high proportion of successful resolutions.
Sentiment trends — Aggregated sentiment signals from conversations over time. A sudden dip in positive sentiment after a knowledge update is a signal worth investigating.
Language breakdown — For multilingual organizations, see which languages your users are communicating in and how that distribution changes over time.
Filtering
All charts are filterable by agent and by tag. If you have multiple agents serving different teams, you can drill into each one independently. Tags let you group conversations thematically for comparison.
Localization
All chart labels, axis titles, and date formats are fully localized — the dashboard displays correctly for English, German, and Japanese users without any configuration.
The analytics layer runs on conversation data that Agentwise already collects. There’s nothing to enable — if you have conversations, you have analytics.